

30%
Fewer surprises
Spot leading indicators early with anomaly alerts across every program.
Analytics
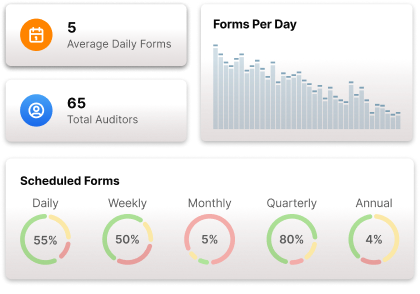
Transform raw observations into actionable intelligence. SafetyLoop analytics surfaces leading indicators so you can intervene before incidents occur.
Spot leading indicators early with anomaly alerts across every program.
Automate board-ready exports that used to take days of spreadsheet work.
Sync field data, HR systems, and contractor records into unified metrics.
Data you can trust
SafetyLoop eliminates data silos by joining submissions, sensor inputs, and compliance events. Filter by any attribute to uncover the story behind the numbers.
Drag-and-drop widgets to build charts, maps, and KPIs tailored to each stakeholder.
Identify hotspots with AI-assisted scoring that ranks emerging risks across sites.
Email or Slack recurring snapshots so leadership never waits for the latest data.
Story-driven reporting
Guide decision makers through timelines, correlations, and root causes with curated layouts. SafetyLoop keeps context attached so teams know exactly what to do next.
Connected intelligence
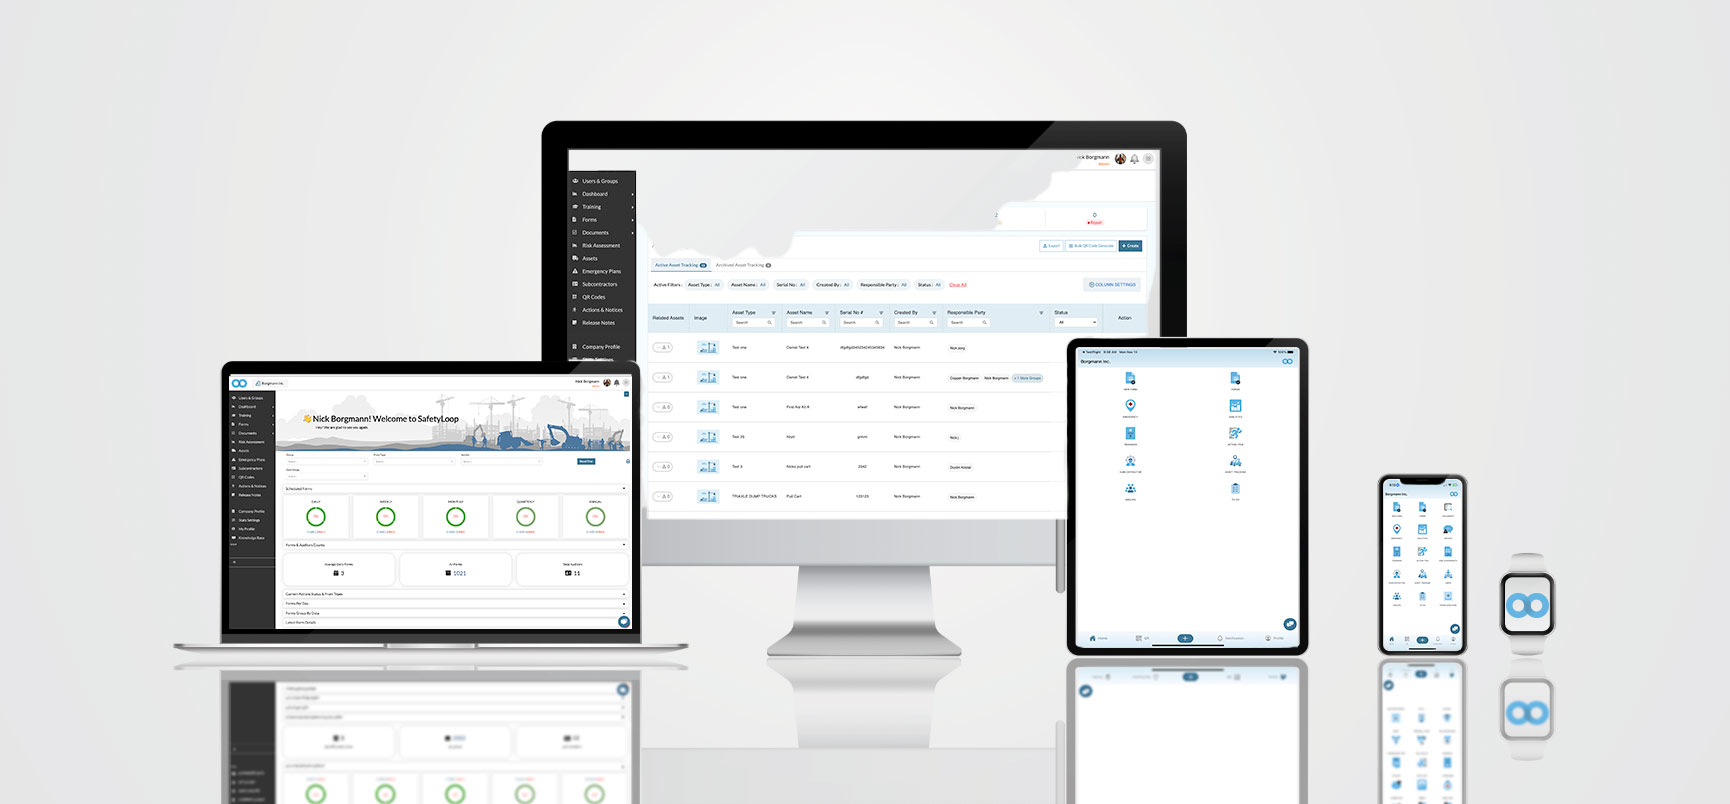
Sync analytics with BI tools, HRIS, and financial systems. Whether you need a CSV or a live API feed, SafetyLoop keeps every team working from the same dataset.
Insight lifecycle
SafetyLoop handles cleansing, enrichment, and delivery so analysts can focus on guidance—not wrangling spreadsheets.
Pull in SafetyLoop modules, IoT sensors, and third-party data via connectors or API.
Slice and dice metrics with filters, saved views, and automated anomaly detection.
Distribute dashboards, exports, and action plans to stakeholders with controlled access.
Data confidence
Empower leadership to invest in prevention, validate programs, and respond to regulators with a click.
Average weekly reporting time reclaimed per safety manager.
Drop in recordable incidents after adopting data-driven reviews.
“Our executive team finally sees live risk trends by region. We stopped debating spreadsheets and started prioritizing the right projects.”
See SafetyLoop in action
Start a complimentary trial or partner with our team for a guided rollout across every project.